Viewing Map-View Model Data
The ROFF Resevoir Model Import example made a ap-view version of the trinidad_model data. Select File, Open Data in New Map Window, BHP-SU to see the data selection window. Select trinidad_model_transpose_ep, and click OK.
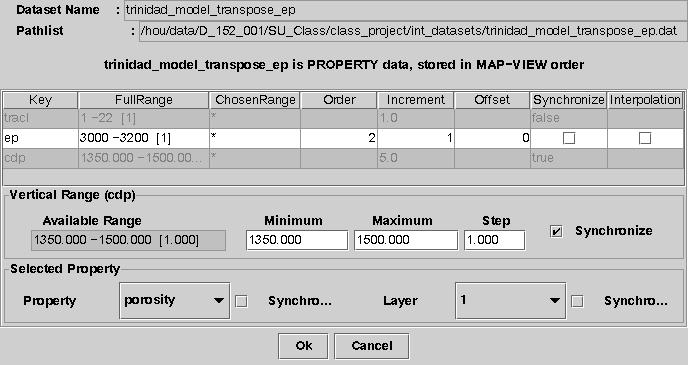
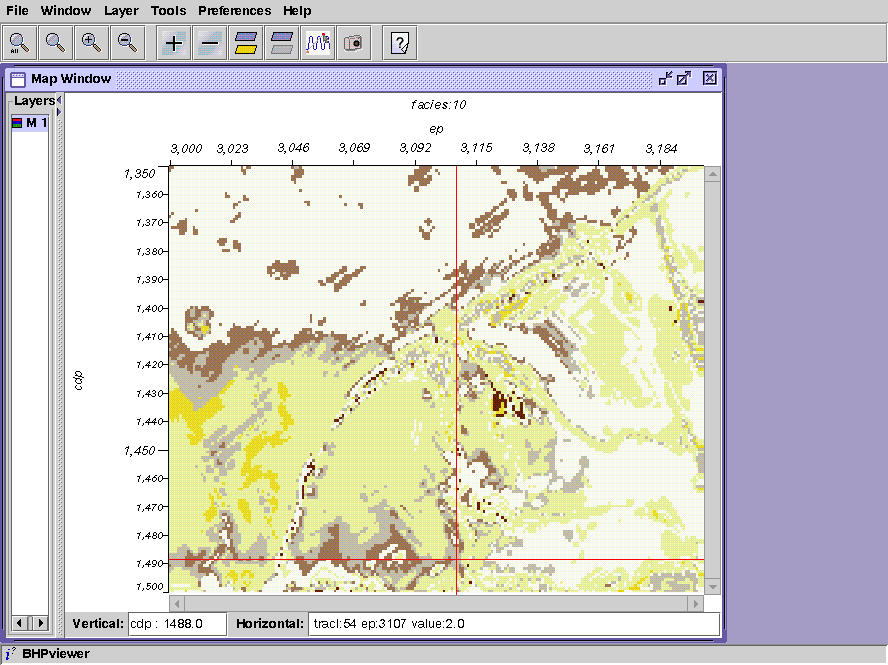
Notice that the Vertical Range is the CDP range for the data. Usually for map-view data you want to see an entire grid at a certain time or depth. Since model depths can change from location-to-location, layers are just numbered from 1 to n. Click on porosity next to Property to see a list of available properties and select Facies. Click on the 1 next to Layer, and select layer 10. Then click OK. Go to the Display Properties menu, and load the sand_shale color map.
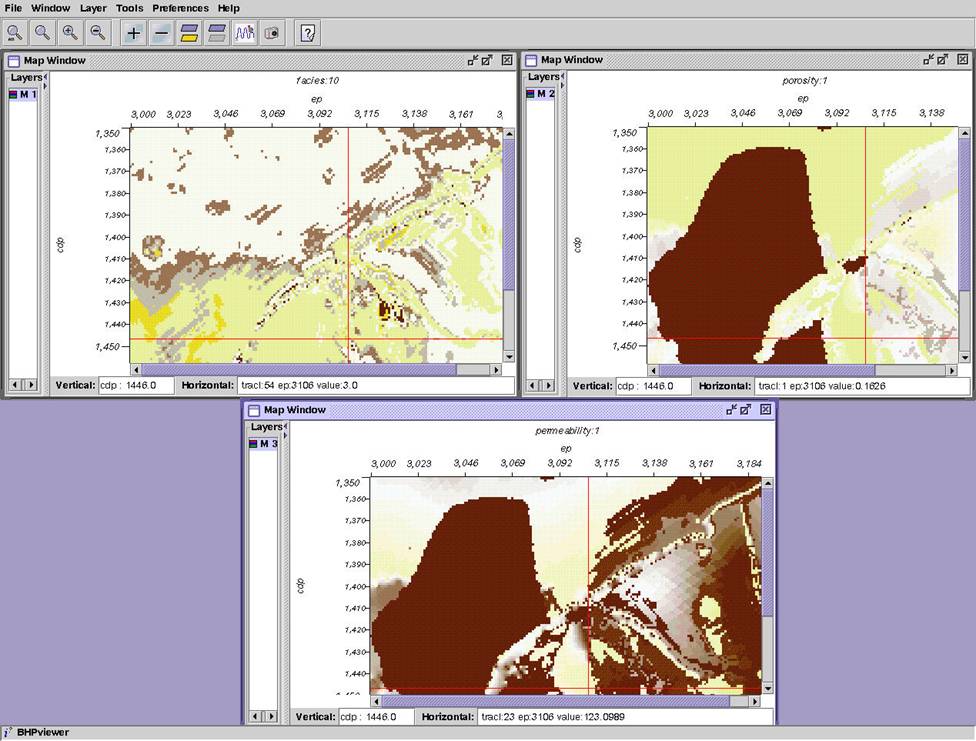
Load the other two properties as separate windows and arrange as shown below.
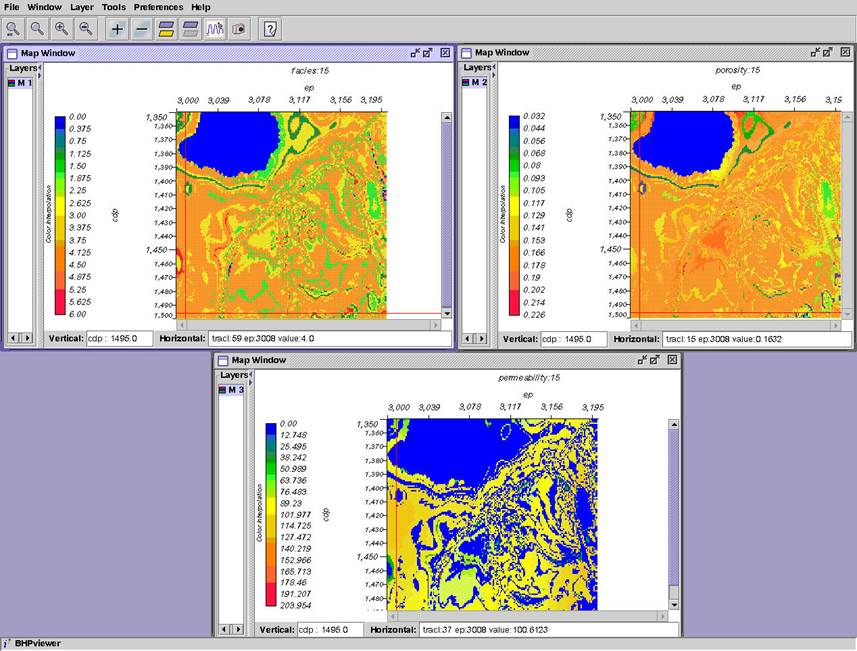
Do some synchronization. For each window got to the Synchronization menu and check Listen to Color Map. Then go to Dataset menu and check Synchro… next to layer number. Go to any Dataset menu and load layer 15. You should see same display as above, but all with layer 15. Change the color map to rainbow. Add a left-hand color bar to each window.