Loading and Viewing a Seismic Cross-Section
User keyboard command input is shown in italics, specific keys are shown in bold italics, and bhpview menu item names are shown in bold.
Step-by-step images for loading and viewing a seismic data volume follow.
There are two ways to start bhpview from UNIX. You can use MB2 to click on the root window, and then select Applications. Near the bottom is Seismic Unix. Click it then click INTviewer Production Environment. You cal also enter bhpview in an xterm window to start the viewer.
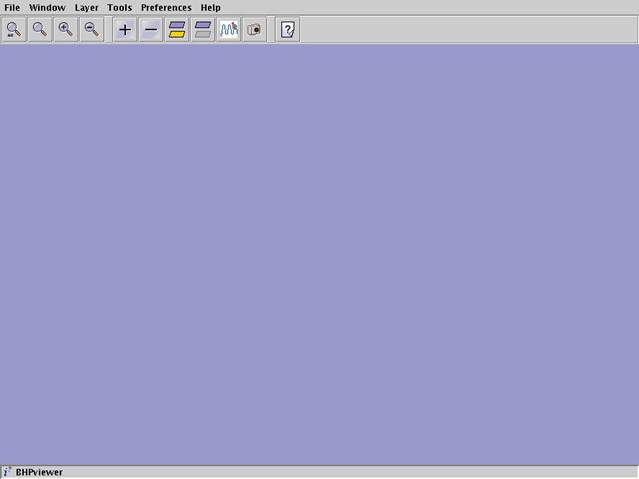
The initial BHPVIEW window is shown below. Select File, then Select Data in New X-Section Window, then BHP_SU. Next you will see the data selection window.
BhpioBinPath is the path to BHP_SU programs, and rarely needs to be changed. BhpDataPath is the location of the int_datasets directory to which bhpview is pointing. If this is not the desired int_datasets directory, you can click in the text box and edit it.
Modify it to point to the bhpview demonstration data and enter Return to see what data is available in the demo directory.
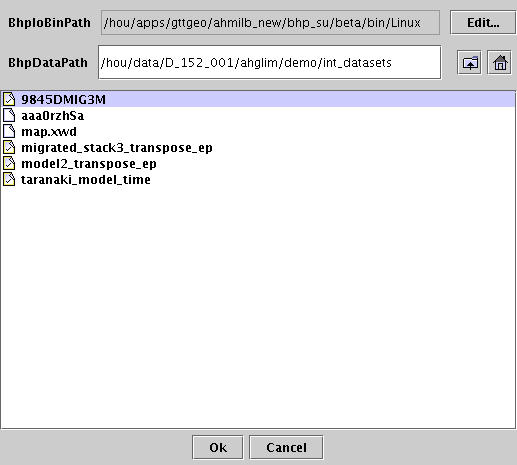
Select the dataset 9845DMIG3M, and click OK. The next display is for selecting the range of data to display.
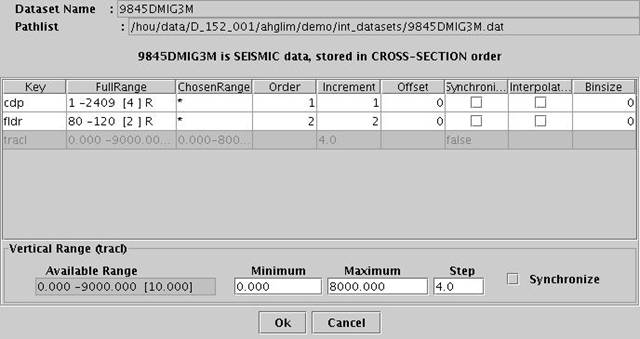
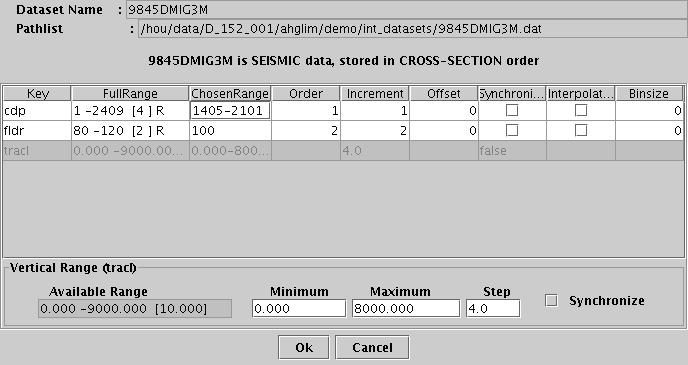
You can see that bhpview has detected that the data is seismic data, stored in cross-section order. The trace header keys and their ranges are shown in the table, and the vertical range of the data is shown at the bottom of the window. Click in the Chosen Range box for cdp, backspace over the *, and enter 1405-2101. Likewise, for ep, enter 100. Then click OK.
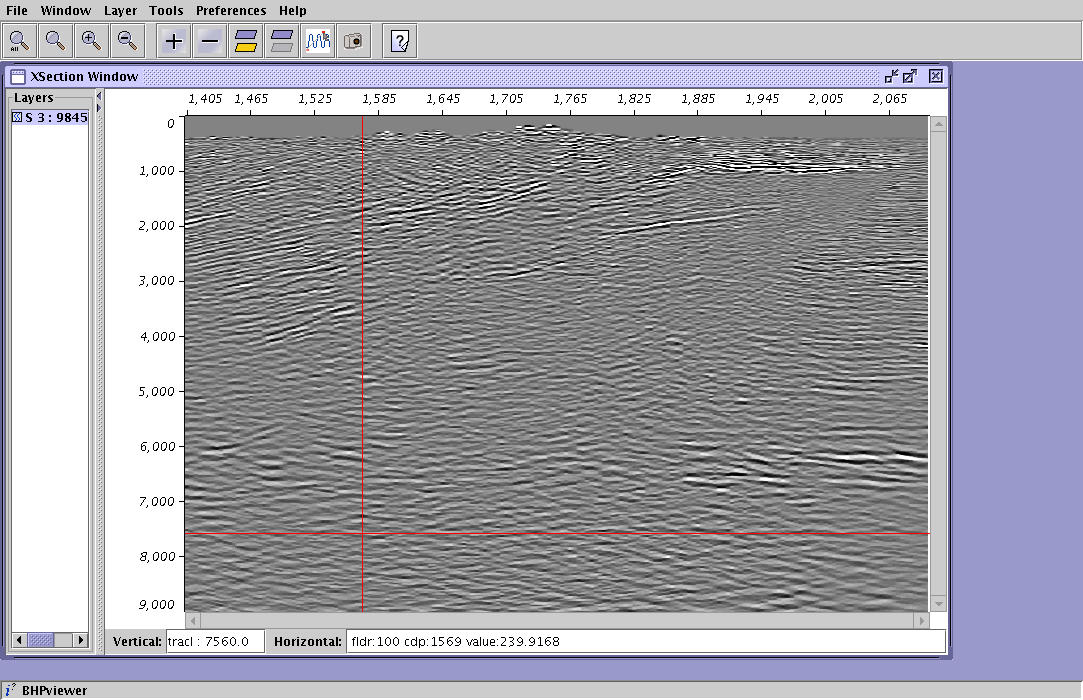
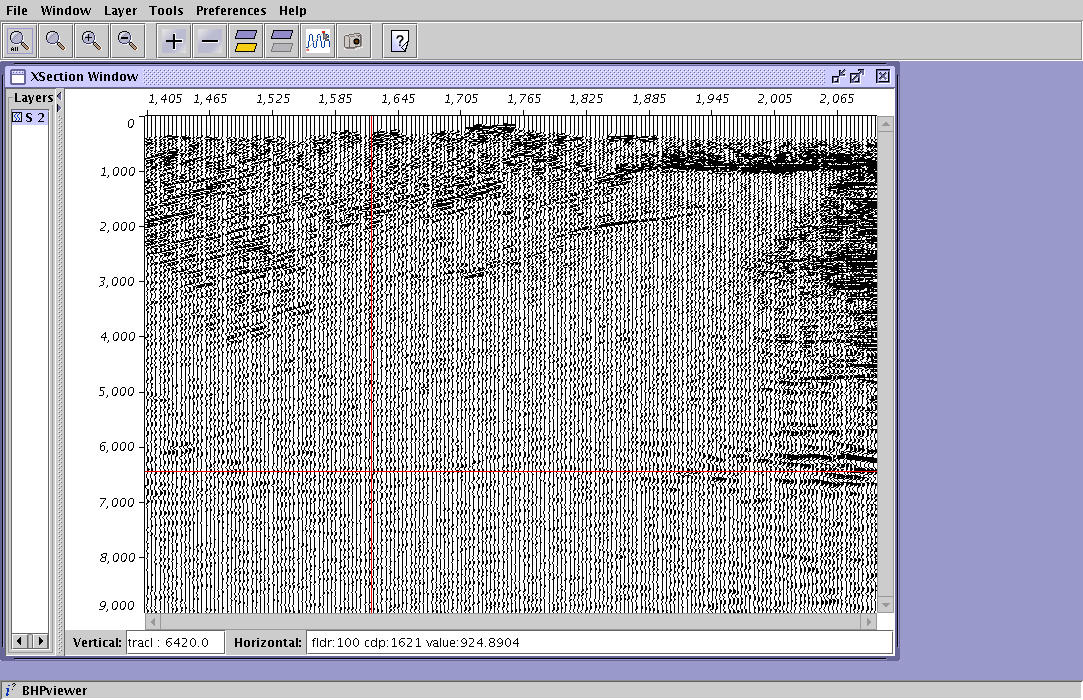
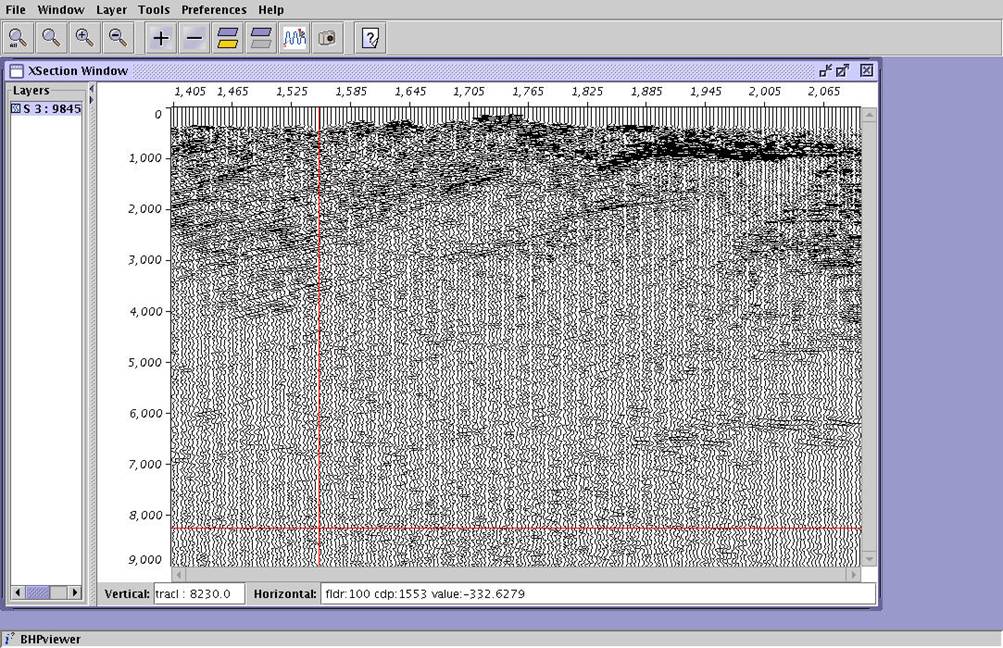
You will then see the first actual data display. You can grab the lower-right corner of the XSection Window to re-size it.
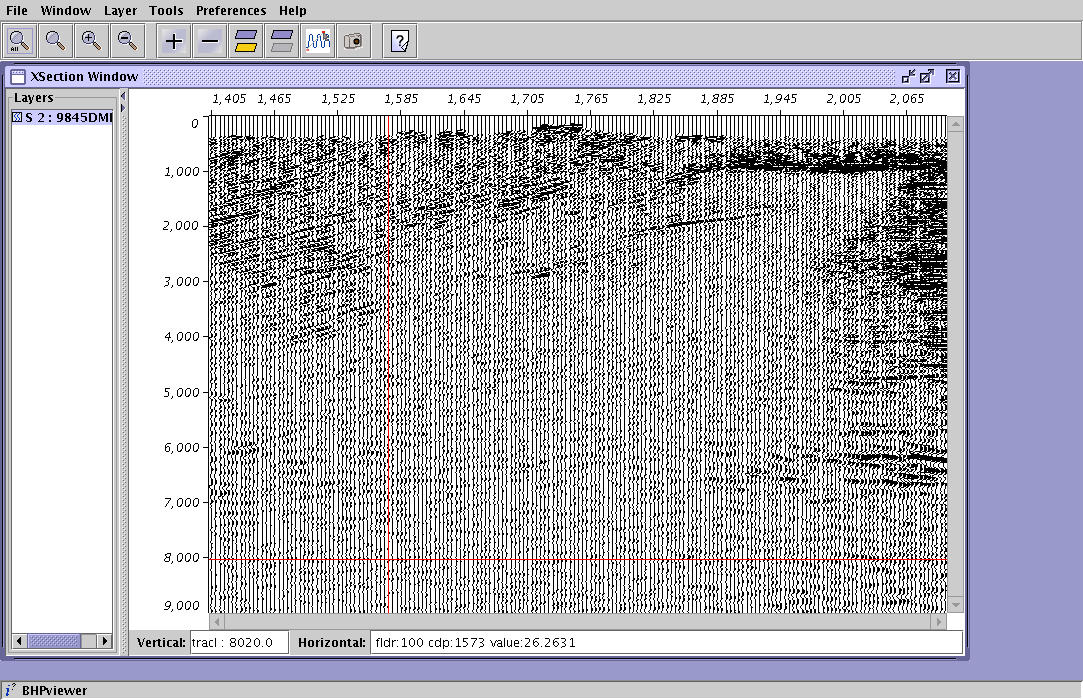
The re-sized window shows more data. To see all the data click the top-left magnifying glass. This button allows you to view the entire line in the current window. In addition, there is a vertical separator just to the left of the data. You can grab it and move it to the right to see the name of the layer currently in the window: S2 : 9845DMIG3M
Now you can start fine-tuning the display. Double-click the wiggle icon next to the layer name to see a new set of menus.
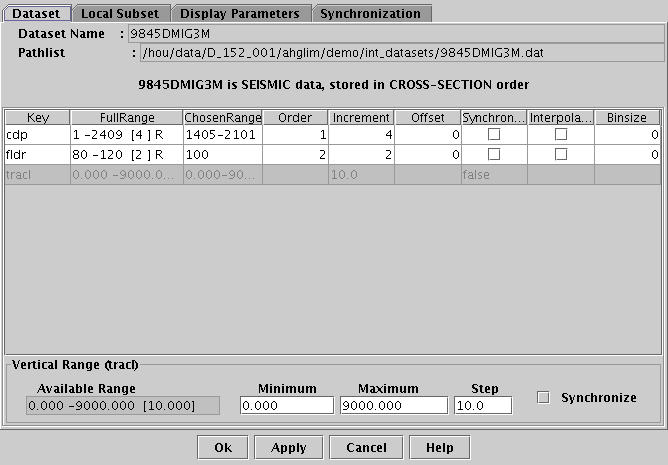
There are four tabs across the top: Dataset, Local Subset, Display Parameters, and Synchronization. These tabs are used to fine-tune the display of each layer in the current set of BHPVIEW windows.
You can see that the Dataset window is the same as the initial data-range selction window from a few frames ago. Once you have started viewing a dataset, you can change the selected range as needed. Click the Display Parameters tab.
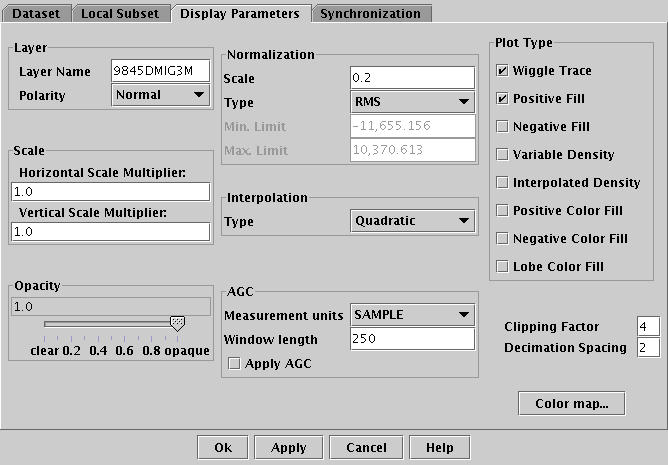
Note the AGC section of the Display Parameters menu. Select the Apply AGC checkbox. Then click Apply to see results. You can experiment with different Window length values to see the effect of a longer-window AGC. Also you can adjust the scaling of the display by changing the Scale value in the Normalization section of this menu. If you want to just see wiggles, turn off the Positive Fill check-box under Plot Type, and click Apply.
To see a density display, click the Interpolated Density check-box, then click Wiggle Trace and Positive Fill, then Apply.